- Research Article
- Open access
- Published:
Development of catheter-type tactile sensor composed of polyvinylidene fluoride (PVDF) film
ROBOMECH Journal volume 6, Article number: 19 (2019)
Abstract
To achieve quantitative palpation in vivo, we developed a catheter-type tactile sensor composed of a polyvinylidene fluoride film for minimally invasive surgery. We evaluated the fundamental performance of the prototype sensor by a weight-drop test. We also measured the output of the prototype sensor as it was inserted into a blood vessel model with shapes mimicking lesions. The ø2-mm sensor passed easily into the blood vessel model with lesion-like shapes. Sensor outputs corresponded to the shape of the inner wall of the blood vessel model, making it possible to determine the position of a protrusion and the convexity interval of a rough surface by filtering and frequency analysis of the output.
Introduction
Tactile sensor for medical applications
Catheters and guidewires are used in the treatment of infarctions and aneurysms. The point of insertion is often the thigh, so the catheters and guidewires must be 1 m or more in length and less than 1 mm in diameter for treatment of the brain. Because wide incisions of tissue are not necessary to approach lesions using catheters and guidewires, this surgery can produce equivalent results with less pain and better functioning compared to open surgery. However, manipulation of these devices is limited to pushing, pulling, and twisting at the proximal portion outside the human body, and the procedure is very difficult due to the small diameter and tortuosity of blood vessels. For example, the inner diameter of the distal part of an internal carotid artery is about 4 mm [1, 2]. Many cerebral aneurysms form at the internal carotid artery, which has a highly curved part called the carotid siphon [3]. In this curved part, the guidewire contacts the blood vessel wall, and friction from this contact makes control of the guidewire difficult. The curvature of many parts of the carotid artery is less than 0.5 1/mm [3, 4]. Furthermore, the surgeon’s sensory perception (visual and tactile) is severely reduced during manipulation in such a surgery because these tools are long and flexible with few degrees of freedom. One method to improve the manipulability of these medical devices is measurement of the tactile force (e.g., excessive contact force) between the device tip and the vessel wall. Therefore, various catheter-type sensors have been developed to measure the contact force [5,6,7,8,9,10].
Unlike these researches, in this study, we developed a catheter-type tactile sensor with another function such as “palpation in vivo” [11, 12]. The mechanical properties of tissues changes due to disease, and tactile sensors can detect this change. In clinical practice, doctors palpate various parts of the human body, such as breast [13] and liver [13, 14]. Nevertheless, manual palpation is subjective and the outcome depends on the experience of the doctor. Therefore, a minimally invasive method that allows quantitative measurement of the mechanical properties is desirable. In vivo measurements are advantageous because the mechanical properties of living tissue change once the tissue is removed from the human body. If an untouchable part can be measured in vivo using a miniaturized tactile sensor quantitatively, as if traced by a finger, it would be possible to obtain new knowledge about living tissue and to establish more accurate diagnosis during minimally invasive surgery. For example, it would be useful to measure the minute surface roughness of the carotid arterial wall to detect an early stage of atherosclerosis, where the luminal surface of the arterial wall becomes rough as a result of endothelial damage [15, 16]. Consequently, it could become possible to prevent the occurrence of strokes and heart attacks. On the other hand, intravascular-imaging modalities such as intravascular ultrasound (IVUS) and intravascular optical coherence tomography (IVOCT) are usually used during treatment for evaluating the blood vessel walls [17,18,19]. However, the resolution of IVUS (100–150 μm) is tenfold lower than that of OCT (10–20 μm). To obtain OCT images from the vessels, the blood needs to be removed from the field of view because near-infrared light is attenuated by the presence of red blood cells. On the other hand, our sensor may be capable of characterizing the surface structure of the vessel wall in greater detail without the necessity of the blood removal.
Various catheter simulators using a computer or blood vessel biomodels have been developed to improve safety in endovascular treatments [20]. Using the tactile sensor, accurate determination of the physical parameters for the numerical simulation and the evaluation of the biomodels could become possible.
Tactile sensors composed of organic ferroelectrics
Typical catheter-type tactile sensors measure force by the piezoresistance effect [5, 7, 11], capacitance [7], pressure-sensitive rubber [12] or the optical measurement [6, 9, 10]. In comparison with other methods, organic ferroelectrics, such as poly(vinylidene fluoride) (PVDF) [8, 14, 21,22,23,24,25,26], which is a copolymer with trifluoroethylene [P(VDF/TrFE)] [27, 28] and VDF oligomer [29, 30], exhibit piezoelectric responses and are useful for tactile sensors. They are promising materials for catheter-type tactile sensors due to the following characteristics:
- 1.
High piezoelectric voltage sensitivity.
- 2.
Flexibility, thinness and low weight: One advantage of organic ferroelectrics is their flexibility. For example, the elastic moduli of PVDF and lead zirconate titanate (PZT) are 2.5 GPa and 83.0 GPa, respectively, the densities of PVDF and PZT are 1.8 and 7.5, respectively [31]. The thickness of the PVDF film used in this study is 40 μm. Because blood vessels are tortuous, an intravascular sensor needs to be flexible. A stiff sensor reduces the overall flexibility of the accompanying medical device, and this rigidity can damage living tissue. Moreover, when used for palpation, the sensor should be flexible because contact with tissue is necessary for palpation.
- 3.
Responsiveness over a wide frequency range.
- 4.
Durability and inertness to chemical agents: PVDF has been successfully used in a number of commercially available products, such as pipes and valves for the chemical industry.
- 5.
Lead-free.
- 6.
The stress rate, not the stress, can be measured (see Eq. (1) for more details).
The piezoelectric coefficient inherent to each material determines the relationship between the mechanical input and the electrical output. Each direction within a film has a different constant, and the output charge of the sample is due to the combination of piezoelectric constants along all directions. Therefore, the output current of a ferroelectric material (I) is expressed as follows:
where A is the area of overlap of the two electrodes, d31, d32, and d33 are the piezoelectric coefficients for the material, σ1 is the applied tensile stress in the drawn direction for PVDF, σ2 is the applied tensile stress in the transverse direction, and σ3 is the normal stress to the plane of the film. Note that, for a given applied force, the output current from the film in the lateral direction is much higher than that in the thickness direction [22]. This is because the extreme thinness of the film results in much higher stresses applied to the film and because of the similarity of the absolute values of d33 and d31 for PVDF.
Measurement of the stress rate is suitable for palpation because it is necessary to measure the difference between healthy and diseased tissues. For example, when measuring the surface roughness of a target object, the detection of subtle differences in height by moving a finger over the surface, much like the way a needle moves over the surface of a record, is a form of active sensing that uses the frequency response characteristics of tactile receptors, as is palpation by a hand. Organic ferroelectrics are suitable for active sensing because the output current is proportional to the stress rate, as shown in Eq. (1). For example, PVDF tactile sensors have already been developed to evaluate human skin and prostate abnormalities [14, 24]. Moreover, using a PVDF film, we also developed a thin plate type tactile sensor to detect micro-step shapes and rough shapes for the quality-check process of manufacturing [32]. For the detection of the early stage of atherosclerosis described in “Tactile sensor for medical applications” section, sub-micron resolution is required because endothelial cells are 10–20 μm thick [15]. However, the surface roughness caused by atherosclerosis in the early stage cannot be measured by conventional B-mode imaging using ultrasonography [15]. On the other hand, as our thin plate type tactile sensor can evaluate the micro-step heights (more than 10 microns) and surface roughness (Ra: 1.6 to 6.3 microns) [32], the application of PVDF tactile sensors to this diagnosis can be expected although the sensor should be inserted invasively and detect the lesion without the help of any image modalities. On the other hand, since there is greater spatial resolution with OCT compared with IVUS, OCT make it possible to assess thin neointimal coverage of drug-eluting stent, and to identify fibrous cap erosion and intracoronary thrombus [17,18,19]. Our sensor with high resolution could be applied to these diagnosis without the necessity of the blood removal.
It is possible to measure the stress itself by measuring the charge using the other preamplifier [26]. But, this technique has several disadvantages. Pyroelectricity, which is concomitant with the piezoelectric effect, is sometimes regarded as a disadvantage of ferroelectric materials because pyroelectricity can cause undesired artifacts in the detection of mechanical signals. When the output current is measured, the signal caused by the stress change can be separated from the signal caused by the temperature change because the stress changes much faster than the temperature [26]. It is also possible to measure the acceleration by the addition of an inertial mass [33]. However, the addition of an inertial mass is not suitable for miniaturization of the sensor.
Based on the characteristics of organic ferroelectrics, we fabricated a prototype catheter-type tactile sensor composed of a PVDF film, whose outer diameter is 2 mm. First, we evaluated the relationship between the tip deformation and the output from the prototype sensor by a simple weight-drop test not affected by electrical noise. Then, assuming the diagnosis of the atherosclerosis and other lesions, we measured the output of the prototype sensor as it was inserted into a blood vessel model with unevenness. Furthermore, because the inner diameter (ID) may become thinner due to stenosis, we also used a blood vessel model with protrusions. We investigated the possibility of determining the protrusion position and inter-convexity interval in regions of surface roughness by output filtering and frequency analysis. Note that, not limited to our group, there is a lack of studies evaluating the outputs from the catheter-type tactile sensor which contacts against the lesion-like shapes.
Experiments
Prototype of tactile sensor composed of PVDF film
A schematic diagram and photograph of the prototype are shown in Fig. 1. As the representative of the ID of the distal part of an internal carotid artery is 4 mm, the prototype sensor was designed to have an outer diameter (OD) of 2 mm. Photographs of the piezoelectric film (K0711-40AS-L20, Kureha Corporation; total thickness: 220 μm, PVDF thickness: 40 μm (two sheets overlaid each other), electrode surface area: 48 mm2) and the resin molds created by a three-dimensional (3D) printer are shown in Figs. 2 and 3, respectively. The purpose of this study is the evaluation of the fundamental performance of the proposed sensor and the outer diameter of the prototype (2 mm) was determined so as not to cut the signal terminal of the piezoelectric film.

Prototype of catheter-type tactile sensor with an outer diameter of 2 mm. a Schematic diagram. b Photograph

Processing of the piezoelectric film. a Photograph. b Schematic diagram

Molds for the base and cover of the prototype sensor. a Molds (A, B and C). b Molds (B and C)
The fabrication process of the prototype is as follows (Fig. 4).

Fabrication process of the prototype sensor
- (1)
As shown in Fig. 2a, a 5-mm-wide piezoelectric film was cut to a width of 2 mm [portion (I), outlined by the dashed yellow line in Fig. 2a] with a utility knife, thus eliminating the ground terminal.
- (2)
We stripped the protective film from the portion outlined by the dashed red line [portion (II)] in Fig. 2 and formed a single terminal by taping the two ground electrodes together with conductive tape (Scotch No. 2245, 3M Japan Limited).
- (3)
We adhered the piezoelectric film in (1) and plastic film (width: 2 mm, length: 20 mm, thickness: 0.125 mm) using an elastic binder. The insertion of the plastic film created a difference between the neutral plane of the sensor and the piezoelectric film. We connected the film electrode to a shielded flexible signal cable (OD: 2 mm) using a conductive adhesive.
- (4)
For the base of the prototype, we poured silicone rubber (KE-106, Shin-Etsu Chemical Co., Ltd.) into mold A (Fig. 3a) and vulcanized it.
- (5)
We bonded the constituents obtained in steps (1)–(3) to the silicone rubber formed in step (4) with elastic adhesive, to obtain the assembly shown in Fig. 5.
Fig. 5 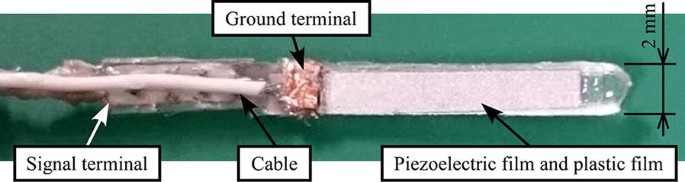
Prototype sensor after the fabrication process as shown in Fig. 4 (5)
- (6)
We placed the assembly obtained in step (5) in mold C, overlaid mold B as shown in Fig. 3b, and injected silicone rubber through the mold ports. Then, we completed the prototype by covering the piezoelectric film and shielded flexible signal cable with silicone rubber.

We made two prototype sensors and used one in the experiments. As the thickness of the rubber is not constant, the improvement of the fabrication process will be necessary in future studies. BNC connectors were attached at the other end of the cable and also to a charge amplifier (LI-76, NF Corporation; gain: 108 V/A). The output voltage of the sensor was acquired through an analog-to-digital converter by a personal computer (sampling frequency: 1 kHz). When the sensor was bent by a force applied at the tip, the PVDF film shifted from the neutral plane as it was stretched or compressed. As shown in Fig. 1a, the PVDF films were embedded to apply tensile stress [σ1 in Eq. (1)] when the sensor was axially stretched. Namely, Eq. (1) can be simplified as follows:
As shown in Fig. 6, assuming an elastic cantilever, when a force (W) is applied on the tip of the sensor, the stress (σ1) applied on the cross section of the PVDF film can be expressed as follows [34]:
where Ep and E are Young’s modulus of PVDF and the sensor, respectively, Is is the area moment of inertia of the sensor, y1 is the distance between the neutral axis and the PVDF film, and a is the distance between the PVDF film and the position where the force is applied. On the other hand, W can be expressed as follows [35]:
where L is the cantilever length and y is the tip deflection. From Eqs. (2), (3) and (4), I is expressed as follows:

Specifications of catheter-type tactile sensor
As shown in Eq. (5), I is proportional to the derivative of the tip displacement. Namely, there is no sensor output by the static displacement. On the other hand, as I is proportional to y1, we can increase I by use of a thicker plastic film although the sensor becomes stiffer.
Weight-drop test
We performed a weight-drop test for the evaluation of the sensor output proportional to the derivative of the tip displacement. As the output current from the sensor is small, we did not use an electric vibrator in order to reduce electrical noise. For example, as the electric noise increases according the vibrator’s velocity, there is a risk that the noise may be misunderstood as the normal output. As shown in Fig. 7, the base of the prototype sensor was firmly secured to a sensor holder. In this figure, the drop direction is aligned in the vertical direction to the piezoelectric film. We aligned the film angle with the naked eye. However, as we did not change the angle during the experiments, it is possible to compare each result relatively. When a weight (0.48 g, ø5.0 mm) was dropped on the tip of the prototype through a hollow cylindrical guide, the sensor outputs were measured. The displacement of the sensor tip along the drop direction was measured using a laser displacement sensor (controller: LK-G5000V, sensor head (spot type): LK-H150 (repeatability: 0.25 µm), Keyence Corporation). The height (h) of the weight above the sensor was changed from 5 to 35 mm at 5-mm intervals, and five measurements were taken at each drop height (sampling frequency: 1 kHz). We applied a 30 Hz low-pass filter to the sensor output to remove power supply noise (60 Hz component) and the longitudinal vibration (perpendicular to the drop direction) components (fL).

Experimental apparatus for the weight-drop test to evaluate the prototype sensor
When one end of an elastic rod is fixed and the other end is free (L = 50 mm), the first natural frequencies of the transverse and longitudinal vibrations of the rod, fT and fL, respectively, are expressed as follows [36]:
where ρ and As and are density and the cross-sectional area of the rod, respectively. If the sensor is composed of only silicone rubber (E = 8.0 MPa, ρ = 1.02 g/cm3), fT and fL are calculated as 9.9 and 4.4 × 10² Hz, respectively.
Insertion into blood vessel model
As shown in Fig. 8, using an automatic stage (SGSP26-200, Sigma Koki Co., Ltd.), we inserted the sensor into two types of transparent blood vessel models. Then, we evaluated the sensor output when the sensor contacted and rubbed against the wall of the blood vessel model. The distance between the sensor tip and the fixed point was 150 mm. The automatic stage was controlled using a stage controller (SHOT-102, Sigma Koki Co., Ltd.). The piezoelectric film is aligned as shown in Fig. 8. The centerline of the blood vessel model has a radius of curvature of 100 mm. In the vessel models Nos. 1 and 2, there are protrusions and unevenness mimicking lesions, respectively (see the next subsections for more details). We used a lubricant [transparent, viscosity: 101.3 mPa s (measured value at 25.1 °C), Elastrat Sàrl] to reduce the surface friction. In future studies, we will consider the other characteristics of the blood vessel such as friction, tortuosity, hardness and flow.

Insertion of prototype sensor into blood vessel model (schematic diagram)
As shown in Fig. 6, the coordinate system attached to the blood vessel wall surface is defined so that x direction is parallel to the wall surface while the sensor tip slides in the x direction wall with sliding velocity u (= dx/dt). Assuming the surface profile as f(x), under the smooth sliding conditions, the sensor tip deflection y can expressed as follows:
From Eqs. (5) and (8), I is expressed as follows:
As shown in Eq. (9), I is proportional to u. Therefore, in this study, we employed faster insertion velocities than those used during the guidewire and catheter insertions [20]. In practical use, it is necessary to move the sensor faster at the area the surgeons want to measure.
Measurement of protrusion position (blood vessel model No. 1)
As shown in the left part of Fig. 8, two internal protrusions each 0.5 mm in height were formed in the urethane tube (ID: 4 mm) by depressing the tube with the hemispherical tip of one cylindrical metal rod (OD: 1 mm) from the upper periphery at 45° and a second from the lower periphery at 60° from the tube mouth. The sensor was inserted into the tube at 40 mm/s, its output on encountering each protrusion in the tube was measured, and the protrusion position was inferred from the sensor output. A high-speed camera (HAS-U1, DITECT Co., Ltd.; 200 frames/s) was positioned at the side of the model and was used for visual observations. Similarly to the weight-drop test, we applied a 40 Hz low-pass filter to the sensor output.
Measurement of convexity interval (blood vessel model No. 2)
The effect of the convexity interval (spatial frequency) on the sensor output was measured, with four variants of blood vessel model No. 2 obtained by 3D printing (stacking pitch: 29 μm), and is illustrated schematically in the right part of Fig. 8. Each model was a curved hollow tube (ID: 8 mm) with a radius of curvature of 100 mm and a roughened region 10 mm long in a straight line on both sides of the 45° angle from the tube mouth on its internal surface. The models differed only in convexity interval (0.5, 0.67, 1.0, or 2.0 mm). In all four models, the convexity pattern was a triangular waveform with a height of 1.0 mm. In future studies, we will use the blood vessel model with smaller height and convexity interval mimicking the lesion. For each model, sensor insertion velocities in the range of 30–80 mm/s in increments of 10 mm/s were used, and five trials were performed for each roughness pattern and insertion velocity. The measured data were processed using short-time Fourier transform (STFT), and the frequency yielding the maximum amplitude was determined. Only frequencies of peaks in the ranges of 10–55 Hz and 65–180 Hz were considered, to exclude the effects of the power supply, DC components, longitudinal and other high-frequency components.
Results and discussions
Weight-drop test
The relationship between the drop height of the weight and the maximum sensor tip displacement is shown in Fig. 9. The relationship between the weight drop height and the peak value of the output after low-pass filtration is also shown in Fig. 9. These values are the averages of five trials. As shown in Fig. 9, the maximum output increased as the weight drop height increased similarly to the tip displacement.

Relationship of peak values between displacement of sensor tip and filtered sensor output
At the moment when the weight contacts with the sensor tip, the free fall velocity (v) is expressed as follows:
where g is gravitational acceleration. As the sensor tip is flexible, dy/dt can be assumed as follows:
Therefore, from Eqs. (5) and (11), I is expressed as follows:
This tendency can be seen in Fig. 9. Substituting h = 5 mm (the lowest drop height) into Eq. (10), we obtain v = 0.3 m/s, which is much faster than the maximum speed of the motorized stage (30 mm/s) used in the insertion experiments into the blood vessel model. Namely, without being affected by electrical noise, we can obtain the large sensor output by the simple weight-drop test. However, as the experimental conditions such as the displacement speed and frequency are not close to the practical ones, another quantitative evaluation method is necessary in the future.
STFT was performed for the sensor output and the sensor tip displacement to find the frequencies with the largest amplitude. The results are shown in Fig. 10. As shown in Fig. 10, the sensor output and the tip displacement had similar frequency components. These results confirmed an increase in sensor output corresponding to the degree of sensor tip displacement and a change in output corresponding to the displacement.

Relationship between weight drop height and maximum amplitude frequency
The fT value (9.9 Hz) is similar to those shown in Fig. 10. When the sensor is used in the human body, L is not fixed, and fT and fL also change in Eqs. (6) and (7). Furthermore, in practical use, the frequency of the sensor output is not limited to the natural frequency and depends on the shape of the inner wall of the blood vessel. Therefore, it would be difficult to remove the noise only with the low-pass filter used in the weight-drop test. In the future, it will be necessary to optimize the sensor structure and investigate a method to reduce the noise. For example, in order to fix L, it may be useful to narrow only the tip of the sensor or to insert the root into a stiff catheter.
Insertion into blood vessel model
Measurement of protrusion position (blood vessel model No. 1)
The ø2-mm sensor passed easily into the blood vessel model with lesion-like shapes. An example of the 40 Hz low-pass filtered sensor output is shown in Fig. 11 when the sensor contacted the protrusion in the tube (Fig. 8). In this figure, (i) and (ii) correspond to the outputs at the first and second protrusions, respectively. The sensor outputs at (i) and (ii) are larger than those acquired at the smooth surface, and we can judge that the inner wall is rough and lesion. The deflection of the sensor at (i) is shown in Fig. 12. In this figure, the outline of the sensor is indicated by a dashed red line. The displacement of the sensor tip (in the direction of the arrow in Fig. 12b) on contact with the protrusion induced by the metal rod No. 1 during the time span of 0.1 s between Fig. 12a, b was accompanied by a strain in the piezoelectric film, resulting in a sensor output. Similarly, at (ii), the sensor tip was deflected in the opposite direction of the arrow in Fig. 12b to avoid the metal rod No. 2.

Filtered sensor output in blood vessel model No. 1

Deflection of prototype sensor in blood vessel model No. 1 on contact with a protrusion. a Before bending. b After bending
The distance of approximately 26 mm between the first and second protrusions implies a difference of 0.65 s in passing the first and second protrusions at the catheter insertion velocity used in this case. As may be seen from Fig. 11, the measured time difference between detections (i) and (ii) (τ) was 0.667 s, which shows that the distance between these two protrusion positions (dP) were effectively detected and indicates that the position of actual stenoses in blood vessels can be detected by this method. Namely, dP can be estimated as follows:
Measurement of roughness (blood vessel model No. 2)
An example of the 40 Hz low-pass filtered sensor outputs are shown in Fig. 13 (convexity interval: 1.0 mm, insertion velocity: 30 mm/s) when the sensor contacted the uneven surface laterally. After the contact against the uneven surface, the outputs became larger than those acquired at the smooth surface, and we can judge that this inner wall is rough and lesion. Calculation from this insertion velocity and convexity interval indicates that the sensor passes a convexity every 0.033 s. The waveform obtained in the experiment, shown in Fig. 13b, indicates transverse fluctuation in the sensor output every 0.033 s, indicating transverse vibration of the sensor tip resulting in characteristic output when passing over the rough surface region. In this model, f(x) can be assumed as follows:
where b and λ are the convexity height and interval, respectively. Substituting Eq. (14) into Eq. (9), I is expressed as follows:

Filtered sensor output in blood vessel model No. 2 (convexity interval: 1.0 mm, insertion velocity: 30 mm/s). a 0–3 s. b 1.22–1.55 s
Therefore, the frequency of the sensor output (fP) is assumed to be u/λ. Namely, λ can be estimated as follows:
In light of this finding, we continued the experiment using different insertion velocities and STFTs for different convexity intervals. Figure 14 shows the results of the measurements in terms of the frequencies at which the largest amplitudes occurred and the insertion velocities, together with theoretical values calculated for the frequency-component peak values by dividing the insertion velocity (u) by the known convexity interval (λ). As shown, the experimentally derived frequencies were near the theoretical values for convexity intervals of 1.0 mm or less. An example of the 40 Hz low-pass filtered sensor output is shown in Fig. 15 (convexity interval: 2.0 mm, insertion velocity: 30 mm/s). The sensor output when passing the concavity/convexity positions with this 2.0-mm interval is smaller than that shown in Fig. 13a for the 1.0-mm intervals. As shown in Eq. (15), this is presumably related to the inverse proportionality of the prototype sensor output to the convexity interval (λ). With a convexity interval of 2 mm, the sensor output may accordingly be expected to be relatively small and thus result in a low signal-to-noise ratio and large error.

Maximum amplitude frequency (blood vessel model No. 2)

Filtered sensor output in blood vessel model No. 2 (convexity interval: 2.0 mm, insertion velocity: 30 mm/s)
In summary, the experimental results indicate that actual regions of arteriosclerosis and other lesions in blood vessels can be detected by this method as changes in surface roughness. In practical use, after the rough screening, it would be useful and efficient to evaluate the area where the sensor outputs became large, as shown in Figs. 11 and 13, in detail.
Future works
The sensor in this study can only detect a uniaxial contact state. Therefore, we are trying to add a piezoelectric film in the silicone rubber so that the sensor can detect a biaxial contact state. In a preliminary study, we created a prototype with an OD of 5 mm (Fig. 16). To detect the biaxial force with this prototype, the two piezoelectric films bisect each other at right angles.

Prototype of biaxial catheter-type tactile sensor. a Schematic diagram. b Photograph
The surface of the current prototype sensor is made of silicone rubber, and the friction coefficient was large. To reduce the friction during the insertion test, we applied a lubricant into the blood vessel model. When the micro-step on the blood vessel model is small, this lubricant affected the measurement accuracy in a preliminary study. To decrease the damage caused by the sensor and improve the measurement accuracy when coming into contact with living tissue during in vivo applications, we are attempting to modify the surface of the sensor to improve its biocompatibility. Moreover, detection of the adsorption force between biomolecules and the diseased tissue by the piezoelectric responses of the organic ferroelectrics could be applied to diagnoses.
Further study will include reduction of the sensor OD to 1 mm for conformity with actual catheter sizes of 1 mm OD or less. One method to miniaturize the sensor is replacing PVDF with P(VDF/TrFE) or VDF oligomer because a thinner film can be prepared by the spin-coating or the vacuum evaporation method [29].
As described in “Insertion into blood vessel model” section, u should be faster to acquire the larger sensor output. Moreover, as shown in Eqs. (13) and (16), dP and λ are proportional to u. Therefore, it is necessary to establish the methods to control and measure u in practical situation.
Conclusions
We fabricated a prototype catheter-type tactile sensor composed of a PVDF film. In a weight-drop test, the maximum sensor output increased as the displacement of the sensor increased. When the sensor tip vibrated laterally, the sensor output had similar frequency components. We also measured the output of the sensor as it was inserted into a blood vessel model with shapes mimicking lesions. The ø2-mm sensor passed easily into the blood vessel model with lesion-like shapes. Sensor outputs corresponded to the shape of the inner wall of the blood vessel model, making it possible to determine the position of a protrusion and the convexity interval of a rough surface. In future studies, we will add a piezoelectric film in the silicone rubber so that the sensor can detect a biaxial contact state. Moreover, future work should include the surface modification and the miniaturization of the sensor.
Availability of data and materials
Not applicable.
References
Hillen B (1986) The variability of the circle of Willis: univariate and bivariate analysis. Acta Morphol Neerl Scand 24:87–101
Schafer S, Hoffmann KR, Noël PB et al (2008) Evaluation of guidewire path reproducibility. Med Phys 35:1884–1892. https://doi.org/10.1118/1.2903430
Hoshina M, Oshima M, Torii R (2005) Parametric study of three-dimensional morphology of the cerebral arterial circle of Willis. Seisan-Kenkyu 57:48–52
Lauric A, Safain MG, Hippelheuser J, Malek AM (2014) High curvature of the internal carotid artery is associated with the presence of intracranial aneurysms. J Neurointerv Surg 6:733–739. https://doi.org/10.1136/neurintsurg-2013-010987
Tanimoto M, Arai F, Fukuda T, et al (1998) Micro force sensor for intravascular neurosurgery and in vivo experiment. In: Proceedings MEMS 98. IEEE. Eleventh annual international workshop on micro electro mechanical systems. An investigation of micro structures, sensors, actuators, machines and systems (Cat. No. 98CH36176). IEEE, New York, pp 504–509
Haga Y, Mineta T, Esashi M (2002) Active catheter, active guide wire and related sensor systems. In: Proceedings of the 5th biannual world automation congress. TSI Press, pp 291–296
Eltaib MEH, Hewit JR (2003) Tactile sensing technology for minimal access surgery—a review. Mechatronics 13:1163–1177. https://doi.org/10.1016/S0957-4158(03)00048-5
WeiXing F, HuanRan W, ShuXiang G, et al (2007) Design and experiments of a catheter side wall tactile sensor for minimum invasive surgery. In: 2007 International conference on mechatronics and automation. IEEE, New York, pp 1073–1078
Nagano Y, Sano A, Sakaguchi M, Fujimoto H (2008) Development of force sensor for extra-fine and long objects. Trans Soc Instrum Control Eng 44:278–284. https://doi.org/10.9746/ve.sicetr1965.44.278
Polygerinos P, Puangmali P, Schaeffter T, et al (2010) Novel miniature MRI-compatible fiber-optic force sensor for cardiac catheterization procedures. In: 2010 IEEE international conference on robotics and automation. IEEE, New York, pp 2598–2603
Ota R (2000) Microfine active bending catheter. J Inst Electr Eng Japan 120:673–676. https://doi.org/10.1541/ieejjournal.120.673
Sekitani T, Zschieschang U, Klauk H, Someya T (2010) Flexible organic transistors and circuits with extreme bending stability. Nat Mater 9:1015–1022. https://doi.org/10.1038/nmat2896
Omata S (2010) Development of a new haptic device using ultrasound technology and its advanced medical applications. J Acoust Soc Japan 66:84–90. https://doi.org/10.20697/jasj.66.2_84
Tanaka M, Nakagawa Y, Tanahashi Y, Chonan S (2003) Computer-aided design of a palpation sensor for detecting prostatic cancer and hypertrophy. Trans Japan Soc Mech Eng Ser C 69:2389–2396. https://doi.org/10.1299/kikaic.69.2389
Kitamura K, Hasegawa H, Kanai H (2012) Accurate estimation of carotid luminal surface roughness using ultrasonic radio-frequency echo. Jpn J Appl Phys 51:07GF08. https://doi.org/10.1143/jjap.51.07gf08
Sho E, Sho M, Singh TM et al (2002) Arterial enlargement in response to high flow requires early expression of matrix metalloproteinases to degrade extracellular matrix. Exp Mol Pathol 73:142–153. https://doi.org/10.1006/EXMP.2002.2457
Rathod KS, Hamshere SM, Jones DA, Mathur A (2015) Intravascular ultrasound versus optical coherence tomography for coronary artery imaging—apples and oranges? Interv Cardiol (London, England) 10:8–15. https://doi.org/10.15420/icr.2015.10.1.8
Kubo T, Imanishi T, Takarada S et al (2007) Assessment of culprit lesion morphology in acute myocardial infarction: ability of optical coherence tomography compared with intravascular ultrasound and coronary angioscopy. J Am Coll Cardiol 50:933–939. https://doi.org/10.1016/J.JACC.2007.04.082
Kubo T, Katayama Y, Emori Y et al (2017) Clinical and technical update on intracoronary optical coherence tomography. J Jpn Coron Assoc 23:41–47. https://doi.org/10.7793/jcoron.23.004
Takashima K, Oike A, Yoshinaka K et al (2017) Evaluation of the effect of catheter on the guidewire motion in a blood vessel model by physical and numerical simulations. J Biomech Sci Eng. https://doi.org/10.1299/jbse.17-00181
Howe RD, Cutkosky MR (1993) Dynamic tactile sensing: perception of fine surface features with stress rate sensing. IEEE Trans Robot Autom 9:140–151. https://doi.org/10.1109/70.238278
Dargahi J (2000) A piezoelectric tactile sensor with three sensing elements for robotic, endoscopic and prosthetic applications. Sens Actuators A Phys 80:23–30. https://doi.org/10.1016/S0924-4247(99)00295-2
Tanaka Y, Sano A, Fujimoto H et al (2007) Tactile sensor and device harmonized with human tactile sensations. IEICE Tech Rep 107(332):97–102
Tanaka M (2008) Sensor system for measuring human touch sensation. J Robot Soc Jpn 26:230–233. https://doi.org/10.7210/jrsj.26.230
Yi Z, Zhang Y, Peters J (2017) Bioinspired tactile sensor for surface roughness discrimination. Sens Actuators A Phys 255:46–53. https://doi.org/10.1016/j.sna.2016.12.021
Shirinov AV, Schomburg WK (2008) Pressure sensor from a PVDF film. Sens Actuators A Phys 142:48–55. https://doi.org/10.1016/J.SNA.2007.04.002
Yamamoto Y, Kure K, Iwai T, et al (2007) Flexible displacement sensor using piezoelectric polymer for intelligent FMA. In: 2007 IEEE/RSJ international conference on intelligent robots and systems. IEEE, New York, pp 765–770
Li C, Wu P-M, Lee S et al (2008) Flexible dome and bump shape piezoelectric tactile sensors using PVDF-TrFE copolymer. J Microelectromech Syst 17:334–341. https://doi.org/10.1109/JMEMS.2007.911375
Takashima K, Horie S, Mukai T et al (2008) Piezoelectric properties of vinylidene fluoride oligomer for use in medical tactile sensor applications. Sens Actuators A Phys 144:90–96. https://doi.org/10.1016/j.sna.2008.01.015
Takashima K, Horie S, Takenaka M et al (2012) Measurement of the piezoelectric properties of vinylidene fluoride oligomer using pneumatic pressure for tactile sensors. J Solid Mech Mater Eng 6:975–988. https://doi.org/10.1299/jmmp.6.975
Miyata S, Furukawa T (1988) Ferroelectric polymers. Kyoritsu Shuppan, Tokyo
Takenaka M, Hirami K, Takashima K (2014) A thin plate type tactile sensor using a piezoelectric polymer. J Robot Soc Japan 32:903–913. https://doi.org/10.7210/jrsj.32.903
Fraden J (2003) Handbook of modern sensors: Physics, designs, and applications, 3rd edn. Springer, Berlin
Takashima K, Takenaka M, Mukai T (2012) Numerical analysis of palpation in vivo using tactile sensor composed of organic ferroelectrics. J Robot Soc Japan 30:195–204. https://doi.org/10.7210/jrsj.30.195
Shibata T, Otani R, Komai K, Inoue T (1991) Zairyo Rikigaku No Kiso. Baifukan, Tokyo
Ariyama M (1970) Vibration and Wave. Shokabo, Tokyo
Acknowledgements
Not applicable.
Funding
This work was supported by JKA’s promotion funds from KEIRIN RACE (26-126); Nakatani foundation for advancement of measuring technologies in biomedical engineering, Japan (Grant No K27-034A); and JSPS KAKENHI Grant Number JP17H06229.
Author information
Authors and Affiliations
Contributions
KT conceived and led the study, and wrote this paper as corresponding author. KO and MY developed the sensor, carried out all experiments, and analyzed data. MT, SH and KI participated in the research design. All authors read and approved the final manuscript.
Corresponding author
Ethics declarations
Competing interests
The authors declare that they have no competing interests.
Additional information
Publisher's Note
Springer Nature remains neutral with regard to jurisdictional claims in published maps and institutional affiliations.
Rights and permissions
Open Access This article is licensed under a Creative Commons Attribution 4.0 International License, which permits use, sharing, adaptation, distribution and reproduction in any medium or format, as long as you give appropriate credit to the original author(s) and the source, provide a link to the Creative Commons licence, and indicate if changes were made. The images or other third party material in this article are included in the article's Creative Commons licence, unless indicated otherwise in a credit line to the material. If material is not included in the article's Creative Commons licence and your intended use is not permitted by statutory regulation or exceeds the permitted use, you will need to obtain permission directly from the copyright holder. To view a copy of this licence, visit http://creativecommons.org/licenses/by/4.0/.
About this article

Cite this article
Takashima, K., Ota, K., Yamamoto, M. et al. Development of catheter-type tactile sensor composed of polyvinylidene fluoride (PVDF) film. Robomech J 6, 19 (2019). https://doi.org/10.1186/s40648-019-0147-9
Received:
Accepted:
Published:
DOI: https://doi.org/10.1186/s40648-019-0147-9