- Research article
- Open access
- Published:
Motion-blur-free video shooting system based on frame-by-frame intermittent tracking
ROBOMECH Journal volume 4, Article number: 28 (2017)
Abstract
In this paper, a concept of frame-by-frame intermittent tracking to achieve motion-blur-free and high-brightness images when video shooting fast moving scenes is proposed. In our tracking concept, two control methods are applied alternately at hundreds of hertz, according to the open or closed shutter state of the camera. When the shutter is open, the target’s speed in images is controlled at zero and visual feedback is transmitted to achieve motion blur reduction, and when the shutter is closed, the camera returns to its home position. We developed a prototype of our motion-blur-free video shooting system, which consists of our tracking method implemented on a high-speed two degrees-of-freedom tracking vision platform that controls the pan and tilt directions of the camera view by using high-speed video processing in order to reduce motion blur. Our motion-blur-free video shooting system can capture gray-level \(512\times 512\) images at 125 fps with frame-by-frame intermittent tracking. Its performance is verified by the experimental results for several video sequences of fast moving objects. In the experiments, without a decrease in the exposure times our method reduced image degradation caused by motion blur.
Introduction
Motion blur is a well-known phenomenon that occurs when shooting images of fast moving scenes. The degradation degree of images caused by motion blur depends on the duration of the camera exposure, as well as on the apparent speed of the target scenes, and the camera’s exposure time is often decreased in order to reduce motion blur. However, a trade-off exists between brightness and motion blur in image shooting, because it is difficult to obtain non-blurred bright images with a decreased exposure time, since less light is then projected onto the image sensor. This trade-off is extremely aggravated in highly magnified observations of fast moving scenes in various application fields, such as flowing cells in microscopic fields, precise inspection of products on a moving conveyor line, and road surface and tunnel wall inspection from a moving car, because the apparent speed of the scene increases in the magnified camera view and the light that is projected on the image sensor diminishes when the magnification is increased.
Motion deblurring is a frequently used approach for reducing this image degradation resulting from motion blur in image shooting. In many studies, approaches [1, 2] were developed that apply blur kernels that express motion blur in the input images; the blurred images are restored by deconvolving the images with the estimated blur kernels. These approaches include single-image deblurring methods [3,4,5] and multi-image deblurring methods [6,7,8]. In the former, the blur kernels are estimated from a single image using parametric models for maximum a-posteriori estimation and in the latter the ill-posed problems in deconvolution are reduced by estimating the blur kernels from multiple images. Several papers have reported motion deblurring methods that consider the camera’s egomotion while the shutter is open, which is estimated by using gyro sensors and accelerometers [9] or the camera’s geometric location [10]. However, most of these methods adopt a software-based approach for image restoration and do not consider the acquisition of blur-free input images. There are limitations to the extent to which images can be improved, in particular when significant changes in the target scene occur in the images captured while the camera shutter is open.
To reduce motion blur resulting from camera shake, a large number of digital cameras with camera-shake reduction systems have been developed that can stabilize input images by shifting their optical systems mechanically. These image stabilization systems are categorized into two types according to the approach that is applied: the lens-shift approach, which shifts a floating lens to move the optical axis [11, 12] and the sensor-shift approach, which shifts the image sensor [13]. These image stabilizers can stabilize input images by controlling the optical path with a floating lens or the position of the image sensor with the camera’s internal sensors, such as its gyro sensor. The camera-shake reduction system is a camera-stabilization approach that uses the camera internal sensors for reducing motion blur resulting from camera shake; it is unsuitable for shooting blur-free images of fast moving scenes when the camera is fixed, because the internal sensors cannot detect any apparent motion in the captured images.
Many high-speed vision systems operating at 1000 fps or more have been developed [14, 15], and visual tracking algorithms, such as optical-flow systems [16] and face-tracking systems [17], have been implemented in high-speed vision systems. The effectiveness of real-time high-speed image processing has been verified in many types of applications, such as robot manipulation [18], flying-object tracking [19], and micro-organism tracking [20, 21]. Such high-speed tracking systems can reduce motion blur without decreasing the exposure time, because they can continuously adjust the position of an object to the center of the camera view by using high-speed visual feedback control. However, in such systems, the camera view is adjusted only for a single target object, and the viewpoints cannot be freely changed when the object is tracked in the camera view.
For viewpoint-free video shooting, Hayakawa et al. [22, 23] developed a galvano-mirror-based tracking system that can compensate motion blur in images by controlling the amplitude of the sinusoid trajectory with high-speed visual feedback using the Bayer block matching method in order to stop background scenes appearing in images while the shutter is open, and conducted high-frame-rate (HFR) video shooting with motion blur reduction for the purpose of highway inspection conducted from a car traveling at 100 km/h. However, the motion blur reduction was limited when the object speed suddenly changed, because of the limited time resolution of the pan-and-tilt mirror control in the galvano-mirror system; it was not so considered for a programable sawtooth-like wave trajectory that enables alternative switching of the mirror speed from the target object’s speed to zero in frame-by-frame intermittent tracking so that both a moving target object and a static background are clearly observed without blurring at the same time.
For microscopic observation with a fixed camera view, Ueno et al. [24] developed a motion-blur-free microscope that can shoot non-blurred videos of unidirectionally moving objects at a high frame rate using a piezo actuator-based microscopic tracking system, in which a concept similar to the frame-by-frame intermittent tracking introduced in this study was applied for motion blur reduction; however, the object speed for motion blur reduction was limited to 10 mm/s or less at submillimeter-level due to the upper limit of the movable range of the 1-DOF linear piezo stage, and it can not use for motion-blur-free video-shooting of general objects fast-moving in real space, which are two-dimensionally moving at several meters per second.
In this paper, we introduce the concept of frame-by-frame intermittent tracking and extend it to a mirror-drive 2-degrees-of-freedom (DOF) piezo actuator-based tracking system for motion-blur-free video shooting of objects moving fast in two dimensions when a high magnification ratio is used. Thus, in this paper, we introduce a frame-by-frame intermittent tracking method to shoot non-blurred and bright videos of fast moving scenes with a fixed camera position by alternating the tracking control methods according to whether the shutter is open or closed. We developed a motion-blur-free video shooting system that simultaneously controls the angles of the pan and tilt mirrors on a 2-DOF piezo actuator-based active vision system for HFR video shooting through the implementation of a frame-by-frame intermittent tracking algorithm in real time. Its performance was verified by the experimental results for several moving scenes.
Frame-by-frame intermittent tracking
Motion blur in video shooting of moving objects depends on their apparent motions on the image sensor when the shutter is open, that is, when the incident light accumulates on the image sensor, whereas their apparent motions cause no motion blur when the shutter is closed, that is, when the image sensor is blind to any incident light. Thus, we introduce a frame-by-frame intermittent tracking method [24] that can reduce motion blur in video shooting by alternating control methods in a high-speed active vision system, from vision-based tracking control to back-to-home control, according to whether the camera shutter is open or closed; the active vision system changes the optical path to the image sensor. This concept is illustrated in Fig. 1. The vision-based tracking control is activated to maintain the relative velocity between the coordinate systems of the object and the image sensor at zero when the shutter is open; it is operated by estimating the apparent velocity of the objects in images in real time. The back-to-home control is activated to reset the optical path of the camera to its home position when the shutter is closed. This control, while requiring no information from the image sensor, ensures that the movable range of the active vision system is not exceeded.

Concept of frame-by-frame intermittent tracking
As compared with methods presented in related papers on motion deblurring and image stabilization, our frame-by-frame intermittent tracking method has the following advantages.
-
1.
Motion-blur-free video shooting Without decreasing the exposure time of the camera, high-brightness images of fast moving objects can be captured without motion blur.
-
2.
Vision-based frame-by-frame image stabilization Without any internal sensor being required, the apparent speed of fast moving objects on the image sensor can be controlled at zero in every frame with real-time motion estimation, which is accelerated by high-speed video processing.
-
3.
Free-viewpoint observation Users can freely alter the viewpoint of the camera, when it is controlled by frame-by-frame intermittent tracking. The method includes fixed-viewpoint observation.
In our method, the frame-by-frame switching viewpoint control from vision-based tracking control to back-to-home control can be expressed with the saw-tooth-like trajectory of the position of the image sensor desired at time \(t, \varvec{p}(t)\), according to whether the shutter is open or closed:
where \(\varvec{p}_0\) is the home position of the image sensor. \(\tau _o\) and \(\tau _c\) are the open and closed shutter duration, respectively. \(\lfloor a \rfloor\) is the maximum integer that does not exceed a and \(t_s(t)=\lfloor t/\tau \rfloor \tau\) is the time at which the image is shot at every frame; it is quantized by the frame-cycle time \(\tau =\tau _o+\tau _c\). Figure 2 illustrates the saw-tooth-like desired trajectory and control chart of our frame-by-frame intermittent tracking method. In Eq. (1), the upper line expresses the control target for vision-based tracking control when the shutter is open, and the lower line expresses the control target for back-to-home control when the shutter is closed. It is assumed that the relative velocity between the coordinate systems for the object and the image-sensor at time \(t_s(t),\, \varvec{v}(t_s(t))\), is estimated by processing the captured images in real time. Thus, the state of the shutter periodically changes between open and closed in every frame, and the two control methods should switch when the video is shot with frame-by-frame intermittent tracking, corresponding to the frame-cycle time \(\tau\).

Control chart of frame-by-frame intermittent tracking
For HFR video shooting of moving objects with frame-by-frame intermittent tracking, a high-speed actuator that can periodically drive the motion of an image sensor at hundreds of hertz or more should be accelerated for frame-by-frame switching of the control methods; its switching frequency perfectly corresponds to the frame rate of a high-speed vision system that can estimate the apparent speeds of moving objects on the image sensor in real time. To design a motion-blur-free video shooting system with frame-by-frame intermittent tracking of moving objects, the following constraints pertaining to a high-frequency response actuator should be considered, as well as the frame rate of the vision system, as illustrated in Fig. 3.
-
1.
Limited moving speed The response of an actuator is determined by its dynamic parameters, such as its mechanical time constant. The speed \({}^s v_{max}\) at which a high-frequency response actuator with a small time constant can move has a certain upper limit. It is difficult to track the target object with no motion blur when its apparent speed v on the image sensor is higher than the upper-limit speed \({}^s v_{max}\) of the actuator.
-
2.
Limited moving range The range in which a high-frequency response actuator can move is in general limited because of the trade-off between its frequency response and the range in which it can move. In frame-by-frame intermittent tracking with exposure time \(\tau\), the actuator should track a target object, the apparent speed of which on the image sensor is v, over the moving distance \(v\tau\) while the shutter is open; however, the motion blur cannot be perfectly reduced when the apparent speed v is higher than \({}^rv_{max}=A_{max}/\tau\).
-
3.
Nonlinear trajectory Assuming that a target object moves at a fixed speed while the shutter is open, to achieve motion blur reduction the linear trajectory of an actuator should be generated by controlling its inclination such that the apparent speed of the target object is cancelled. Most high-frequency response actuators achieve their high-frequency drives with low damping ratios by reducing their viscosities, such as frictions, whereas it takes a certain time to attenuate their ringing responses once resonant oscillation starts. In frame-by-frame intermittent tracking at hundreds of hertz or more, the interval of the intermittent drive of a high-frequency response actuator is not significantly larger than its damping ratio, and there remain certain nonlinear deviations with ripples in the actuator’s trajectory; these may still leave motion blurs in images.

Constraints of high-frequency response actuator
Motion-blur-free video-shooting system
System configuration
We developed a prototype motion-blur-free video-shooting system, which is designed for frame-by-frame intermittent tracking to allow zoom-in imaging of fast moving objects without incurring motion blur. The system consists of a high-speed vision platform (IDP Express) [15], a CCTV zoom lens, two piezo tilt stages (PT1M36-500S-N, Nano Control Co., Japan) with mirror surfaces, and a personal computer (PC) with an ASUSTeK P6T7 WS Supercomputer mainboard, Intel Core i7 960 3.20-GHz CPU, 6-GB memory, Windows 7 Professional 32-bit OS, and a D/A board (PEX-340416, Interface Co., Japan). Figure 4 provides an overview of the prototype system when the HTZ-11000 (Joble Co., Japan) was used as the CCTV zoom lens.

Overview of motion-blur-free video-shooting system
IDP Express includes a camera head and an FPGA image processing board (IDP Express board). The camera head has a \(512\times 512\) pixel CMOS image sensor, the sensor and pixel size of which are \(5.12 \times 5.12\) mm and \(10 \times 10 \,\upmu\)m, respectively. The camera head was mounted on the camera port of the CCTV zoom lens. The IDP Express board was designed for high-speed video processing and recording, and we could implement image processing algorithms by hardware logic on the FPGA (Xilinx XC3S5000); it was mounted using a PCI-e \(2.0\times 16\) bus I/F on the PC. The 8-bit grayscale \(512\times 512\) images and processed results could be simultaneously transferred at 2000 fps to the allocated memory in the PC.
Two piezo tilt stages were used for a mirror-drive 2-DOF active vision system to realize frame-by-frame intermittent tracking in pan and tilt directions. The piezo tilt stage can shift its surface in the rotation direction with a \(2.78\times {10^{-6}}{^\circ }\) resolution, and its size, weight, resonant frequency, and the range within which it can move are \(36\times 42 \times 29\) mm, 100 g, 3900 Hz, and \(0.173{^\circ }\), respectively, when no objects are mounted on it. On the surface of the piezo stage, a \(30\times 30\times 5\,\)mm-size aluminum mirror (TFA-30S05-1, Sigma Koki Co., Japan) weighing 20 g was mounted. The piezo stage for the pan angle was installed 25 mm in front of the CCTV-zoom lens, and that for the tilt angle was installed 75 mm in front of that for the pan angle; the light from the target object passes to the tilt-mirror stage and the pan-mirror stage, and then is captured on the image sensor on the camera head. The drive voltage for the piezo stages, supplied by a high-capacity piezo driver (PH601, Nano Control Co., Japan), was 0–150 V, and the motor commands from the PC were amplified in the piezo driver in order to operate the piezo stages periodically.
In this study, a frame-by-frame intermittent-tracking algorithm was software-implemented on the PC. The apparent speed of the objects in images was estimated in real time using the results processed on the IDP Express board, and motor commands were transferred to the piezo stage via the D/A board to reduce motion blur in the images. Corresponding to the drive voltage 0–150 V of the piezo stage, analog voltage signals in the range of 0–10.24 V were outputted from the D/A board mounted on the PC; these signals were converted at a high rate from the 12-bit digital sequences stored in the buffer of the D/A board. The details are described in the following subsection.
Integrated algorithms
Assuming that a single object to be captured on video is moving two-dimensionally at a certain velocity on a plane that is parallel to the image sensor’s plane, and the object’s apparent velocity in images is proportional to its actual velocity on the plane, the following algorithm was implemented in the prototype system in order to observe a single object in an image.
-
1.
Binarization A grayscale \(512\times 512\) input image I(x, y, t) is captured at time \(t=k\tau\) at an interval \(\tau\) with an exposure time \(\tau _o\). I(x, y, t) is binarized with the threshold \(I_B\) into B(x, y, t). The apparent velocity of the object in the image at time t is estimated as \(\varvec{v}(t)=(\varvec{c}(t)-\varvec{c}(t-\tau ))/\tau\) with the image centroids \(\varvec{c}(t)=\) \((M_{10}/M_{00}\), \(M_{01}/M_{00})\) at time t and \(t-\tau\). The apparent angular velocity of the object in the pan and tilt directions of a zooming optical system, \(\varvec{\omega }(t)=(\omega _\phi (t),\omega _\psi (t))\), is proportional to \(\varvec{v}(t)\) as
$$\begin{aligned} \varvec{\omega }(t)={A}(\varvec{c}(t)-\varvec{c}(t-\tau ))/\tau , \end{aligned}$$(2)where A is a constant parameter determined by the magnification ratio of the zooming optical system, the pixel pitch of the image sensor, and the distance between the object and the optic center of the optical system. \(M_{00}\), \(M_{10}\), and \(M_{01}\) are the zero- and first-order moment features of B(x, y, t) defined as
$$\begin{aligned} M_{mn}(t)=\sum _{X,Y} x^my^n\cdot B(x,y,t),\quad (m,n)=(0,0), (1,0), (0,1). \end{aligned}$$(3) -
2.
Trajectory generation for intermittent tracking The desired angular trajectory in the pan and tilt directions of the mirror-drive 2-DOF active vision system, \(\varvec{\theta }_d(t)=(\phi _d(t), \psi _d(t))\), is generated using the apparent angular velocity of the target object, \(\varvec{\omega }((k-1)\tau )\), which is estimated at \(t=(k-1)\tau\), in order to cancel its apparent motion on the image sensor when the shutter is open from \(t=k\tau\) to \(k\tau +\tau _o\):
$$\begin{aligned} \hat{\varvec{\theta }}_d(t)= \;&(\hat{\phi }_d(t),\hat{\psi }_d(t)) \nonumber \\= & {} \left\{ \begin{array}{ll} \varvec{\omega }((k-1)\tau )\,(t-k\tau -\tau _r) + \varvec{\theta }_0 \quad &{} (-\,\tau _r \le t-k\tau< \tau _o)\\ (f(t;\phi _d(k\tau +\tau _o),{\phi }_{0}),\, f(t;\psi _d(k\tau +\tau _o),\,{\psi }_{0}) ) \quad &{} (\tau _o \le t-k\tau < \tau _b+\tau _o) \\ \varvec{\theta }_0 \quad &{} (\text{otherwise}) \end{array} \right., \end{aligned}$$(4)$$\begin{aligned} \varvec{\theta }_d(t)= & {} {\left( \text{med}(\phi _{min},\hat{\phi }_d(t),\phi _{max}),\text{ med }(\psi _{min},\hat{\psi }_d(t),\psi _{max})\right),} \end{aligned}$$(5)where \(\text{ med }(a,b,c)\) indicates the median value of a, b, and c. \(\varvec{\theta }_0=(\phi _0,\psi _0)\) indicates the pan and tilt angles for the home position, and \([\phi _{min}, \phi _{max}]\) and \([\psi _{min}, \psi _{max}]\) indicate the movable ranges of the pan and tilt angles of the mirror-drive 2-DOF active vision system, respectively. \(\tau _t\) and \(\tau _b\) refer to the duration times of the vision-based tracking control and back-to-home control, respectively. \(\tau _r=\tau _t-\tau _o\) is the delay time required for the mirror-drive 2-DOF active vision system to match the apparent motion of the object in the image, corresponding to its rise time. \(f(t;\phi _d(k\tau +\tau _o),{\phi }_{0})\) and \(f(t;\psi _d(k\tau +\tau _o),{\psi }_{0})\) are the fifth-order polynomial trajectory functions that ensure that the back-to-home control moves the mirror-drive 2-DOF active vision system smoothly from \(\varvec{\theta }_d(k\tau +\tau _o)\) to \(\varvec{\theta }_0\) to avoid a large acceleration. Figure 5 shows the timing chart for the generation of the trajectory.
Fig. 5 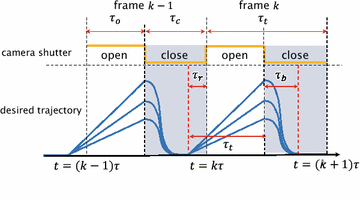
Frame-by-frame intermittent tracking trajectory
-
3.
Control of mirror-drive 2-DOF active vision system After storing the desired trajectory for the duration time \(\tau _t+\tau _b\), the D/A board begins sending motor commands at \(t=k\tau -\tau _r\) in synchronization with the image capture timing. The motor commands for the pan and tilt angles are amplified to the drive voltages in the mirror-drive 2-DOF active vision system as
$$\begin{aligned} \varvec{V}(t)=(V_\phi (t),V_\psi (t))=(b_\phi \phi _d(t)+c_\phi ,b_\psi \psi _d(t)+c_\psi ), \end{aligned}$$(6)where the parameters \((b_\phi ,c_\phi )\) and \((b_\psi ,c_\psi )\) are determined by verifying the actual pan and tilt trajectories of the mirror-drive 2-DOF active vision system.

Specifications
Using this prototype system, \(512\times 512\) input images were captured at 125 fps, with a frame interval of \(\tau =8\,\)ms and exposure time of \(\tau _o= 4\,\)ms. The duration times of the vision-based tracking control and back-to-home control were set to \(\tau _t\) \(=\) 4.5 and \(\tau _b\) \(=\) 2.0 ms, respectively; the tracking time \(\tau _t\) included a delay time of \(\tau _r= 0.5\,\)ms. The desired trajectory of the pan and tilt angles of the mirror-drive 2-DOF active vision system was generated as two 16-bit digital sequences at 200 kHz for a duration of \(\tau _t\) + \(\tau _b\) \(=\) 6.5 ms; 1310 16-bit data for each angle were updated with an 8-ms cycle time. The home positions of the pan and tilt angles of the mirror-drive 2-DOF active vision system were set to one end of their movable range such that \(\varvec{\theta }_0=\varvec{0}\), where their drive voltages were 0 V. Because of the narrow movable ranges of the pan and tilt angles of the 2-DOF active vision system, \(0.17{^\circ }\) and \(0.14{^\circ }\), respectively, the maximum speed of objects under observation without motion blur being incurred was determined theoretically by the ratio of the movable range of the duration time of the open exposure. Considering that the variations in the view angles via the mirrors correspond to twice those of the mirror angles, the maximum angular speeds for the pan and tilt angles are 67.1\({^\circ }\)/s and 49.7\({^\circ }\)/s, respectively. When the focal length of the zoom lens and the pixel pitch of the image sensor are f [mm] and \(\Delta x =0.01\) mm, respectively, one pixel corresponds to \(57.3 \tan ^{-1}(\Delta x/f) \approx 0.573 f^{-1}{^\circ }\), assuming \(f \gg \Delta x\); \(1{^\circ }\) corresponds to 1.75f pixel. When \(f= 112.5\) mm, the maximum apparent speeds in the x and y directions on the image sensor for objects under observation without motion blur being incurred are 13.0 and 9.7 pixel/ms, respectively, corresponding to the displacements of 52.2 and 38.6 pixels in the x and y directions during an exposure time of 4 ms. When \(f= 650\) mm, the maximum apparent speeds in the x and y directions on the image sensor for objects under observation without motion blur being incurred are 76.1 and 56.4 pixel/ms, respectively, corresponding to the displacements of 304 pixels and 225 pixels in the x and y directions during an exposure time of 4 ms.
The binarization in Step 1 and the calculation of the moment features in Step 2 were implemented with parallel hardware logic for 8-bit gray-level images on the user-specific FPGA of the IDP Express board. The other steps were software-implemented as multithreaded processes with parallel executions on the PC. The execution time for Steps 1 and 2 was 0.108 ms and for Steps 3 and 4 0.887 ms. The total execution time was 1.01 ms. We confirmed that all the processes could be executed for \(512\times 512\) images in real time at 125 fps with an exposure time of 4 ms.
Experiments
Preliminary trajectory evaluation
First, we conducted a preliminary experiment to verify the relationship between the input voltages to the piezo stages of the mirror-drive 2-DOF active vision system and its angular displacements in the pan and tilt directions when the active vision system was periodically operated on a designed trajectory at a frequency of 125 Hz. We determined the parameters \((b_\phi ,c_\phi )\) and \((b_\psi ,c_\psi )\), which are expressed in Eq. (6), of the trajectory of the active vision system during the time when the shutter is open, and quantified the nonlinear deviations with ripples in the pan and tilt trajectories. In the experiment, the periodic voltage wave at a cycle time of \(\tau =8\) ms was inputted to the piezo stage, as shown in Fig. 6; the input voltage wave was set to a linear waveform from 0 V to a maximum voltage \(V_{max}\) in a period \(\tau _t=4.5\) ms, where \(V_{max}\) was set to 15, 30, 45, 60, 75, 90, 105, 120, 135, and 150 V. To measure the pan and tilt angles of the active vision system, a laser beam spot for observation was redirected by the mirrors of the active vision system, and the locations of the laser beam spot projected on a screen at a distance of 4350 mm from the active vision system were extracted offline by capturing an HFR video at 10,000 fps.

Input waveform for piezo stages of mirror-drive 2-DOF active vision system
Figure 7 shows the angular displacements of the pan and tilt angles of the active vision system for 30 ms when the periodic input voltage waves, the maximum voltages of which varied from 0 to 150 V, at 125 Hz were applied to the piezo stages. In both the pan and tilt angles, the angular displacements were periodically changed at a frequency of 125 Hz in proportion to the amplitudes of the input voltage waves, whereas they involved certain ripple waves because of their resonant vibrations. The observed resonant frequencies in the pan and tilt angles were approximately 730 and 850 Hz, respectively; they were one-fifth or less of 3900 Hz, which is the resonant frequency of the piezo stage when no object is mounted on it. The decrease in the resonant frequencies was caused mainly the mirror attached to the piezo stage. It can be observed that the resonant frequency in the tilt angle was less than that in the pan angle, and the amplitude of the ripple in the tilt angle was more than that in the pan angle, because the tilt angular motion was more strongly affected by gravity than the pan angular motion.

Angular displacements of mirror-drive 2-DOF active vision system. a Pan. b Tilt
When the angular trajectories during the exposure time \(\tau =\,4\) ms were linearized by the least squares method, Fig. 8 shows the relationship between their inclinations and the input voltages to the piezo stages. It can be observed that the inclinations of the angular trajectories, which correspond to the apparent angular velocity of the target object, varied linearly with the amplitudes of the input voltages; the parameters in Eq. (6) were estimated as \((b_\phi ,c_\phi )=\) (2.10, 4.47) and \((b_\psi ,c_\psi )=\) (2.91, 1.61) for the pan and tilt angles, respectively. Figure 9 shows the relationship between the estimated angular speeds \(\tilde{\varvec{\omega }}=(\tilde{\omega }_\phi ,\tilde{\omega }_\psi )\) and the averaged deviations \((\Delta \phi _d, \Delta \psi _d)\) from the approximated lines during 4 ms. In the figure, the ratio of the averaged deviation \((\Delta \phi _d, \Delta \psi _d)\) to the estimated angular displacement \((\phi _{mv},\psi _{mv})=(\tilde{\omega }_\phi \tau ,\tilde{\omega }_\psi \tau )\) during the exposure time \(\tau =4\,\)ms, \((\Delta \phi _d / \phi _{mv}, \Delta \psi _d / \psi _{mv})\), is also plotted; the ratio indicates the percentage by which our frame-by-frame intermittent tracking method can reduce motion blur in shooting fast moving objects. When the maximum voltage of the input image was 150 V, the angular speeds and the averaged deviations are 49.7\({^\circ }\)/s and 1.91 \(\times\,10^{-2}{^\circ }\) for the pan angle and 67.1\({^\circ }\)/s and 3.64 \(\times 10^{-2}{^\circ }\) for the tilt angle; the ratios \((\Delta \phi _d / \phi _{mv}, \Delta \psi _d / \psi _{mv})\) were 9.3 and 12.8 %. It can be observed that the deviation error from the approximate line becomes larger as the angular speeds become larger in both the pan and tile angles. The ratio \((\Delta \phi _d / \phi _{mv}, \Delta \psi _d / \psi _{mv})\) was not so significantly changed with the estimated angular speeds, whereas the ratio of the tilt angle was larger than that of the pan angle because of the effect of gravity. Thus, we should consider image degradation with a certain motion blur with the above-mentioned ripple deviations in motion-blur-free video shooting at 125 fps.

Estimated inclinations of angular displacements and input voltages

Relationship between estimated angular speeds and deviation errors
Circle-dot motion at constant speeds
Next, we conducted video shooting experiments for a circle-dot pattern to verify the relationship between the speed of an object and its motion blur. The pattern was moved along (1) the horizontal direction and (2) the oblique direction with an inclination of 20\({^\circ }\), at constant speeds of 0, 250, 500, 750, and 1000 mm/s using a 1-DOF linear slider. In the experiment, the HTZ-11000 (Joble Co., Japan) was used as the CCTV zoom lens; its focal length was set to \(f=650\,\)mm. The linear slider was located at a distance of 4350 mm from the mirror-drive 2-DOF active vision system; the \(35\times 35\,\) mm area on a plane at a distance of 4350 mm corresponded to an image region of \(512\times 512\) pixels, and \(6.84\times 10^{-2}\) mm corresponded to one pixel. We can cancel motion blur during the 4 ms exposure when shooting a target object moving at 5.21 and 3.86 m/s on a plane 4350 mm in front of the mirror-drive 2-DOF active vision system in the vertical and horizontal direction, respectively, corresponding to its apparent motions at 304 and 225 pixels during the 4 ms exposure time in the x and y direction on the image sensor. Figure 10 shows (a) an overview of the experimental environment, (b) the circle-dot pattern to be observed, and (c) the configuration of the experimental setting. The 4-mm-diameter circle dots were black-printed at intervals of 50 mm on a white sheet of paper.

Experimental environment and circle-dot pattern to be evaluated. a Overview. b Circle dots to be evaluated. c Experimental setting
Figure 11 shows the \(227\times 227\) images cropped from the \(512\times 512\) input images so that the circle dot is located at their centers, and Fig. 12 shows the brightness profiles of 256 pixels on a horizontally intersected line of images when the circle dot moved at 0, 250, 500, 750, and 1000 mm/s in the horizontal direction. The threshold for binarization was \(I_B=50\). As observed in Figs. 11 and 12, the input images captured with frame-by-frame intermittent tracking (IT) were compared with those captured without mechanical tracking (NT) and their motion deblurring (MD) images. The MD images were obtained by processing the NT images offline using a non-blind convolution method with a line kernel function [25]. The NT images became increasingly blurred in the horizontal direction as the speed of the circle dot increased, whereas the IT images remained almost entirely free of blurring regardless of the speed. Figure 13 shows the \(227\times 227\) images cropped from the \(512 \times 512\) input images when the circle dot moved in the oblique direction. It can be seen that frame-by-frame intermittent tracking achieves motion-blur-free video shooting of the object moving in the oblique direction, as well as in the horizontal direction; the NT images are blurred in the \(20{^\circ }\) oblique direction, whereas the IT images are without blur at all the slider speeds. In the MD images, most of motion blurs were remarkably reduced, whereas certain ghost errors remained in the moving directions especially when the circle-dot moved by dozens of pixels during the camera shutter was open. This is because it is difficult for deconvolution-based methods to completely reduce large motion blurs for nonlinear brightness images with zero or saturation.

Images captured when a circle dot moved in the horizontal direction. a With tracking (IT). b Without tracking (NT). c Motion deblurring (MD)

Intersected brightness profiles when a circle-dot moved in the horizontal direction. a With tracking (IT). b Without tracking (NT). c Motion deblurring (MD)

Images captured when the circle dot moved in the oblique direction. a With tracking (IT). b Without tracking (NT). c Motion deblurring (MD)
To evaluate the degree of motion blur of the observed the circle dot, the index \(\Delta \lambda =\lambda _+-\lambda _-\) was introduced; \(\lambda _+\) and \(\lambda _-\) represent the lengths of the major and minor axes of the approximated ellipse of the circle dot in the image. The index \(\Delta \lambda\) increases as the motion blur increases in the image, and is zero when the dot is a perfect circle in the image. \(\lambda _+\) and \(\lambda _-\) were estimated offline by calculating the zero-, first-, and second-order moment features for the circle-dot region in the image, which was extracted by binarization with a threshold of 63. Considering the offset \(\Delta \lambda _0=2.6\) pixel when no motion is present, the blur index \(\Delta \lambda '=\Delta \lambda - \Delta \lambda _0\) was evaluated for the IT and NT images in Figs. 11 and 13. Figure 14 shows the relationship between the speed of a circle dot and its blur index \(\Delta \lambda '\) for the IT and NT images; \(\Delta \lambda '\) was averaged for the speeds of 50 selected images. The blur index \(\Delta \lambda '\) for the IT images was remarkably low at all the speeds as compared with that for the NT images; it became larger as the speed of the circle dot increased. When the circle dot moved in the horizontal direction, the blur index \(\Delta \lambda '\) for the IT images was 0.9, 2.3, 3.1, and 2.7 pixel at 250, 500, 750, and 1000 mm/s, respectively; this corresponds to 13.3, 14.3, 11.5, and 7.4% of the respective value of \(\Delta \lambda '\) for the NT images. When the circle-dot moved in the oblique direction, \(\Delta \lambda '\) for the IT images was 0.1, 1.9, 2.6, and 2.3 pixel at 250, 500, 750, and 1000 mm/s, respectively; this corresponds to 1.6, 14.9, 12.2, and 7.5% of the respective value of \(\Delta \lambda '\) for the NT images. In the experiment, the speed of the circle dot was 1 m/s or less, which is considerably lower than the maximum motion-blur-free speeds of 5.21 m/s in the horizontal direction and 3.86 m/s in the vertical direction, and our frame-by-frame intermittent tracking method noticeably reduced motion blur of circle dots moving at all the speeds in video shooting with the exposure time of 4 ms, whereas slight motion blur remained in the IT images because of nonlinear deviations with ripples on the trajectory of the mirror-drive 2-DOF active vision system.

Motion blur indexes for circle dots moving at different speeds
Table tennis ball motion at constant speeds
Next, we conducted video shooting experiments for fast moving table tennis balls launched by a table tennis machine to verify motion blur when the speed of the object to be observed is larger than the maximum motion-blur-free speed of our mirror-drive 2-DOF active vision system. Figure 15 shows (a) an overview of the experimental environment, and (b) the 40-mm-diameter table tennis balls that were observed. The table tennis machine (TSP Hyper S-2, Yamato Takkyu Co., Japan) was installed 4350 mm in front of the mirror-drive 2-DOF active vision system, and a table tennis ball (plain) was launched in (1) the horizontal direction, and (2) the oblique direction with an inclination of 20\({^\circ }\) at constant speeds of 3, 4, 5, 6, and 7 m/s. In the experiment, a CCTV lens of \(f= 75\) mm was used with a 1.5\({\times }\) extender; the \(200\times 200\) mm area on a plane at a distance of 4350 mm corresponded to an image region of \(512\times 512\) pixels and 0.391 mm corresponded to one pixel. When observing an object moving fast on a plane of 4350 mm in front of the mirror-drive 2-DOF active vision system, the maximum motion-blur-free speeds were 5.21 m/s in the horizontal direction and 3.86 m/s in the vertical direction, corresponding to its apparent motions at 52.2 and 38.6 pixels during the exposure time of 4 ms.

Experimental environment and observed table tennis balls. a Overview. b Table-tennis balls to be evaluated
Figures 16 and 17 show the \(227\times 227\) images cropped from the \(512\times 512\) input images [(a) IT images, (b) NT images] so that the table tennis ball is located at their centers when it is thrown in the horizontal direction and oblique direction. As compared with the input images captured when a table tennis ball was thrown at 3, 4, 5, 6, and 7 m/s, the input image of a motionless table tennis ball (0 m/s) is illustrated. The threshold for binarization in frame-by-frame intermittent tracking was \(I_B=50\). It can be seen that the IT images remained almost blur-free, regardless of the speed, and they were similar to the input images captured when the ball speed was 0 m/s, whereas the motion blur of the table tennis balls in the NT images increased in both their moving directions as their speed increased.

Images captured when the table tennis ball was thrown in the horizontal direction. a With tracking (IT). b Without tracking (NT)

Images captured when the table tennis ball was thrown in the oblique direction. a With tracking (IT). b Without tracking (NT)
Figure 18 shows the relationship between the speed of a table tennis ball and its blur index \(\Delta \lambda '\) for the IT and NT images. Considering the offset \(\Delta \lambda _0=1.22\) pixel in the case of no motion, \(\Delta \lambda '\) of those for 50 selected images, which were binarized with a threshold of 55, was averaged, in a manner similar to that in the experiment using circle-dot motion. As compared with the blur index \(\Delta \lambda '\) for the NT images, the blur index \(\Delta \lambda '\) for the IT images was remarkably low at all the speeds in the horizontal and oblique directions. The blur index \(\Delta \lambda '\) for the IT images at 3, 4, 5, 6, and 7 m/s in the horizontal direction was 0.05, 0.26, 0.20, 0.70, and 2.20 pixel, respectively, which corresponds to 1.1, 2.6, 1.1, 2.7, and 6.5% of the respective value of \(\Delta \lambda '\) for the NT images. The blur index \(\Delta \lambda '\) for the IT images at 3, 4, 5, 6, and 7 m/s in the oblique direction was 0.05, 0.42, 0.71, 1.63, and 2.33 pixel, respectively, which corresponds to 0.8, 3.2, 3.8, 6.4, and 6.8% of the respective value of \(\Delta \lambda '\) for the NT images. The blur index \(\Delta \lambda '\) for the IT images showed a tendency to increase slightly when shooting a video of a table tennis ball thrown at 6 and 7 m/s in the horizontal and oblique directions. This is mainly because the speed of the table tennis ball was so much higher than the maximum motion-blur-free speed (5.21 m/s in the horizontal direction, 3.86 m/s in the vertical direction) that the moving distance during an exposure time of 4 ms exceeded the upper limit of the movable range of the 2-DOF mirror-drive active vision system.

Motion blur indexes for table tennis balls thrown at different speeds
Table tennis ball motion at variable speeds
Next, we show the experimental results for the video of a table tennis ball identical to that used in the previous subsection, when the table tennis ball was alternately launched from the table tennis ball machine at different speeds of 3 and 5 m/s at intervals of 0.5 s. Figure 19a shows the 2-s temporal changes of the estimated speed and blur index \(\Delta \lambda '\) for the IT images with frame-by-frame intermittent tracking, as compared with (b) those for the NT images when the table tennis balls were passing in front of the mirror-drive 2-DOF active vision system in a manner similar to that when capturing the IT images. Corresponding to the launching interval of a table tennis ball and its passing time duration over a whole image region of \(512\times 512\) pixels, the speeds of the table tennis balls in images were discontinuously estimated in time; the passing time durations were 66.7 and 40.0 ms when a table tennis ball was thrown at 3 and 5 m/s, respectively; they correspond to the duration times for capturing eight and five frame images at 125 fps, respectively.
It can be seen that the ball speed was estimated as a pulse wave, in which a 3-m/s-amplitude pulse of 66.7-ms-width and a 5-ms-amplitude of 40-ms-width appear alternately at intervals of 0.5 s, and the blur index \(\Delta \lambda '\) for the NT images also alternated between 7 and 20 pixels. The blur index \(\Delta \lambda '\) for the IT images became a certain large value of 7 and 20 pixels exactly when the table tennis ball thrown at 3 and 5 m/s appeared in the image, whereas it was remarkably reduced around 1 pixel dozens of milliseconds after its appearance in the image; this corresponds to the duration time for capturing two frame images at 125 fps. The latency in motion blur reduction is caused mainly by (1) the time delay in frame-by-frame intermittent tracking, involving a one-frame-delay in estimating the ball speed using image features computed at the previous frame and a one-frame delay in reflecting it to the pan-tilt actuation of the 2-DOF mirror-drive active vision system, and (2) underestimated speed exactly when the table tennis ball appears in the field of camera view because of its partial appearance at the right side of the images.

Estimated speed and motion-blur index when table tennis balls were thrown at variable speeds. a With tracking (IT). b Without tracking (NT)
Figure 20 shows (a) a sequence of the images with frame-by-frame intermittent tracking, and (b) a sequence of the images without tracking when a table tennis ball with printed patterns, as illustrated in Fig. 15b, thrown at 3 m/s in the horizontal direction, was passing over the whole image region from right to left, taken at intervals of 16 ms; the upper images are the \(512\times 512\) input images, and the lower ones are the \(132\times 132\) images cropped from them so that the table tennis ball is located at their centers. It can be seen that the NT images are too heavily blurred to allow recognition of the letter patterns printed on the table tennis ball in all the frames. For the IT images, the input image was largely blurred at the start frame when the table tennis ball appeared at the right side in the image, whereas the blurring of the input images in all the remaining frames was reduced to the extent that the letter pattern of “hello, world!” at the center of the table-tennis ball can always be recognized.
Nevertheless, a two-frame delay remains in frame-by-frame intermittent tracking for motion blur reduction. Our system can capture less-blurred input images with a dozens-of-millisecond delay for a table tennis ball thrown at 8.0 m/s or less; its passing time over a whole image region of \(512\times 512\) pixels was larger than 24 ms for capturing three frame images at 125 fps.

Series of images captured when a table tennis ball was thrown in the horizontal direction. a With tracking (IT). b Without tracking (NT)
Conclusion
In this study, we developed a motion-blur-free video shooting system based on a concept of frame-by-frame intermittent tracking, in which the control of the camera shutter state is alternated at a rate of hundreds of fps. The target’s speed in images is controlled at zero during exposure; otherwise, the camera’s position returns to its home position. Our system can capture \(512\times 512\) images of fast moving objects at 125 fps with an exposure time of 4 ms without motion blur being incurred by controlling the pan and tilt directions of a mirror-drive 2-DOF active vision system using high-speed video processing. The system’s performance was verified by conducting several experiments using fast moving objects. We focused on motion blur reduction for moving objects in uniform backgrounds in this study, whereas both moving objects and static backgrounds can be clearly observed without blurring when the mirror speed is alternatively switched from the target object’s speed to zero in frame-by-frame intermittent tracking so that image capturing “with tracking” (IT) and “without tracking” (NT) can be simultaneously conducted. Currently, the limited responses of the piezo actuators become the major bottleneck in frame-by-frame intermittent tracking at a higher frame rate; the duration time for back-to-home-control is 2 ms or more on our system, whereas the duration time for vision-based tracking control was set to approximately 4 ms, as shown in the angular displacements in Fig. 7. On the basis of these results, we plan to improve our motion-blur-free video shooting system by adapting it for video shooting of fast moving objects in complex scenes with improved accuracy using fast general-purpose motion detection algorithms and faster frame-by-frame intermittent tracking using a free-vibration-type actuator such as a resonant mirror vibrating at hundreds or thousands of hertz, to apply our motion-blur-free video shooting system to highly magnified observations of fast moving scenes in various applications, such as the precise inspection of products moving fast on a conveyor line and tunnel and road inspection from a car moving at a high speed.
References
Kundur D, Hatzinakos D (1996) Blind image deconvolution. IEEE Signal Process Mag 13(3):43–64
Campisi P, Egiazarian K (2007) Blind image deconvolution: theory and applications. CRC Press, Boca Raton
KuKim S, KiPaik J (1998) Out-of-focus blur estimation and restoration for digital auto-focusing system. Electron Lett 34(12):1217–1219
Fergus R, Singh B, Hertzmann A, Roweis ST, Freeman WT (2006) Removing camera shake from a single photograph. ACM Trans Graphic 25(3):787–794
Tai Y-W, Tan P, Brown MS (2011) Richardson-Lucy deblurring for scenes under projective motion path. IEEE Trans Pattern Anal Mach Intell 33(8):1603–1618
Bascle B, Blake A, Zisserman A (1996) Motion deblurring and super-resolution from an image sequence. In: Proceedings of European conference on computer vision, pp 571–582
Farsiu S, Robinson MD, Elad M, Milanfar P (2004) Fast and robust multiframe super resolution. IEEE Trans Image Proc 13(10):1327–1344
Chen J, Yuan L, Tang C-K, Quan L (2008) Robust dual motion deblurring. In: Proceedings IEEE conference computer vision pattern recognition, pp 1–8
Joshi N, Kang SB, Zitnick CL, Szeliski R (2010) Image deblurring using inertial measurement sensors. ACM Trans Graphic 29(4):30
Kim MD, Ueda J (2015) Dynamics-based motion de-blurring for a PZT-driven, compliant camera orientation mechanism. Int J Robotics Res 34:653–673
Canon IS technology. http://www.usa.canon.com/cusa/consumer/standard_display/Lens_Advantage_IS/
Nikon’s effective VR system. http://imaging.nikon.com/lineup/lens/concept/vr/en/
Sony SteadyShot™ INSIDE. http://www.sony-mea.com/microsite/dslr/10/tech/steadyshot.html
Watanabe Y, Komuro T, Ishikawa M (2007) 955-fps real-time shape measurement of a moving/deforming object using high-speed vision for numerous-point analysis. In: Proceedings IEEE international conference on robotics and automation, pp 3192–3197
Ishii I, Tatebe T, Gu Q, Moriue Y, Takaki T, Tajima K (2010) 2000 fps real-time vision system with high-frame-rate video recording. In: Proceedings IEEE international conference robotics and automation, pp 1536–1541
Ishii I, Taniguchi T, Yamamoto K, Takaki T (2012) High-frame-rate optical flow system. IEEE Trans Circuits Syst Video Technol 22(1):105–112
Ishii I, Ichida T, Gu Q, Takaki T (2013) 500-fps face tracking system. J Real Time Image Process 8(4):379–388
Namiki A, Hashimoto K, Ishikawa M (2003) A hierarchical control architecture for high-speed visual servoing. Int J Robotics Res 22(10-11):873–888
Okumura K, Yokoyama K, Oku H, Ishikawa M (2015) 1 ms auto pan–tilt—video shooting technology for objects in motion based on Saccade Mirror with background subtraction. Adv Robotics 29(7):457–468
Oku H, Ishii I, Ishikawa M (2000) Tracking a protozoon using high-speed visual feedback. In: Proceedings 1st annual conference on microtechnologies in medicine and biology, pp 156–159
Gu Q, Aoyama T, Takaki T, Ishii I (2015) Simultaneous vision-based shape and motion analysis of cells fast-flowing in a microchannel. IEEE Trans Automat Sci Eng 12(1):204–215
Hayakawa T, Watanabe T, Ishikawa M (2015) Real-time high-speed motion blur compensation system based on back-and-forth motion control of galvanometer mirror. Opt Express 23(25):31648–31661
Hayakawa T, Ishikawa M (2016) Development of motion-blur-compensated high-speed moving visual inspection vehicle for tunnels. Int J Struct Civil Eng Res 5(2):151–155
Ueno T, Gu Q, Aoyama T, Takaki T, Ishii I, Kawahara T (2015) Motion-blur-free microscopic video shooting based on frame-by-frame intermittent tracking. In: Proceedings IEEE international conference automation science engineering, pp 837–842
Levin A, Sand P, Cho TS, Durand F, Freeman WT (2008) Motion-invariant photography. ACM Trans Graph 27(3):71
Authors’ contributions
MI carried out the main part of this study and drafted the manuscript. MJ and YM set up the experimental system of this study. TT and II contributed concepts of this study and revised the manuscript. All authors read and approved the final manuscript.
Acknowledgements and funding
A part of this research was supported by the Adaptable and Seamless Technology Transfer Program through Target-Driven R&D (No. AS2615002J), JST, Japan.
Competing interests
The authors declare that they have no competing interests.
Availability of data and materials
Not applicable.
Consent for publication
Not applicable.
Ethics approval and consent to participate
Not applicable.
Publisher's Note
Springer Nature remains neutral with regard to jurisdictional claims in published maps and institutional affiliations.
Author information
Authors and Affiliations
Corresponding author
Rights and permissions
Open Access This article is distributed under the terms of the Creative Commons Attribution 4.0 International License (http://creativecommons.org/licenses/by/4.0/), which permits unrestricted use, distribution, and reproduction in any medium, provided you give appropriate credit to the original author(s) and the source, provide a link to the Creative Commons license, and indicate if changes were made.
About this article

Cite this article
Inoue, M., Jiang, M., Matsumoto, Y. et al. Motion-blur-free video shooting system based on frame-by-frame intermittent tracking. Robomech J 4, 28 (2017). https://doi.org/10.1186/s40648-017-0096-0
Received:
Accepted:
Published:
DOI: https://doi.org/10.1186/s40648-017-0096-0